
Why project control works so well for some projects and fails so miserably for others
Submitted by Mario Vanhoucke on Fri, 12/30/2011 - 09:55
Controlling the performance of a project in progress is key to the success or failure of a project. It requires a set of metrics to measure the current progress and to forecast the future expected project behavior such that the project manager is able to timely detect project problems and take corrective actions to bring the project back on track. In order to be able to take high quality corrective actions, the project manager should set action thresholds that act as triggers to take these actions, which can be done in two ways:
- A bottom-up control approach using schedule risk analysis
- A top-down control approach using earned value management
In this article, the efficiency of both approaches is analyzed and results are reported.
Project control
In a bottom-up control approach, the lowest levels of the work breakdown structure (WBS) serve as static predictors of the impact changes might have on the project objective. More precisely, sensitivity information for each activity obtained from a schedule risk analysis (SRA) enables the project manager to distinguish between sensitive and insensitive activities. Action thresholds can then be set at a certain sensitivity value such that the activities with a higher sensitivity value than the action threshold value are said to be risky and are assumed to have a huge potential impact on the project objective. This limited set of activities requires an intensive control during project progress and might be subject to corrective actions in case these activities might endanger the project. This bottom-up control approach is explained in detail in the article “Bottom-up project control: Setting action thresholds using schedule risk analysis”.
A top-down project control approach requires a dynamic knowledge of the overall project performance at a current moment in time, which is provided by earned value management (EVM) indicators such as the schedule and cost performance indices. These indicators serve as early warning signals and must trigger corrective actions when they drop below a predefined acceptable threshold. In this case, the project manager must drill down to the lower levels of the work breakdown structure to find the set of activities that are in trouble and that need to be put back on the right track. This drill-down project control is described in the article “Top-down project control: Setting action thresholds using earned value management”.
Control efficiency
The action thresholds in both control approaches define the points of focus and attention of the project during project progress and serve as triggers to take corrective actions to bring project in trouble back on the right path. Consequently, in order to efficiently control projects in progress, the project manager must have access to reliable data provided by SRA or EVM metrics. This should enable the manager to focus on the activities in trouble in order to take high quality corrective actions that bring the project performance back to normal. Therefore, setting action thresholds involves a trade-off between the intensity of control at the lowest WBS levels and the potential impact actions might have on the overall project objective (highest WBS level).
-
Intensity of control: The value of the action thresholds defines the intensity of control and consequently the effort a project manager has to make during project progress. A low control intensity runs the risk of masking problems in certain activities in progress which will only be detected much later in the project life. A higher control intensity reduces the risk that problems in activities will not be detected but results in a higher effort for the project manager.
- Bottom-up control: Low (high) thresholds result in a bigger (smaller) set of activities that are assumed to be sensitive and hence result in a higher (lower) intensity of control.
- Top-down control: Low (high) thresholds mean that the probability to drill down decreases (increases) and hence this results in a lower (higher) intensity of control.
-
Impact of actions: When actions are taken in order to bring activities in progress back to their expected behavior, the project manager aims at bringing the project performance back on track as stipulated in the baseline schedule.
- Bottom-up control: Corrective actions taken on very sensitive activities probably might have a bigger beneficial impact on the project objective than actions taken on activities which are assumed to have a lower impact. Selecting the right activities during a schedule risk analysis is therefore crucial in a bottom-up control approach.
- Top-down control: Selecting the activities at the right moment is crucial to detect the activities in progress that really cause the project problems. Therefore, reliable performance data during project progress to drill down to the project activities at the crucial moment in the life of the project are essential for the quality of the corrective action decision making process.
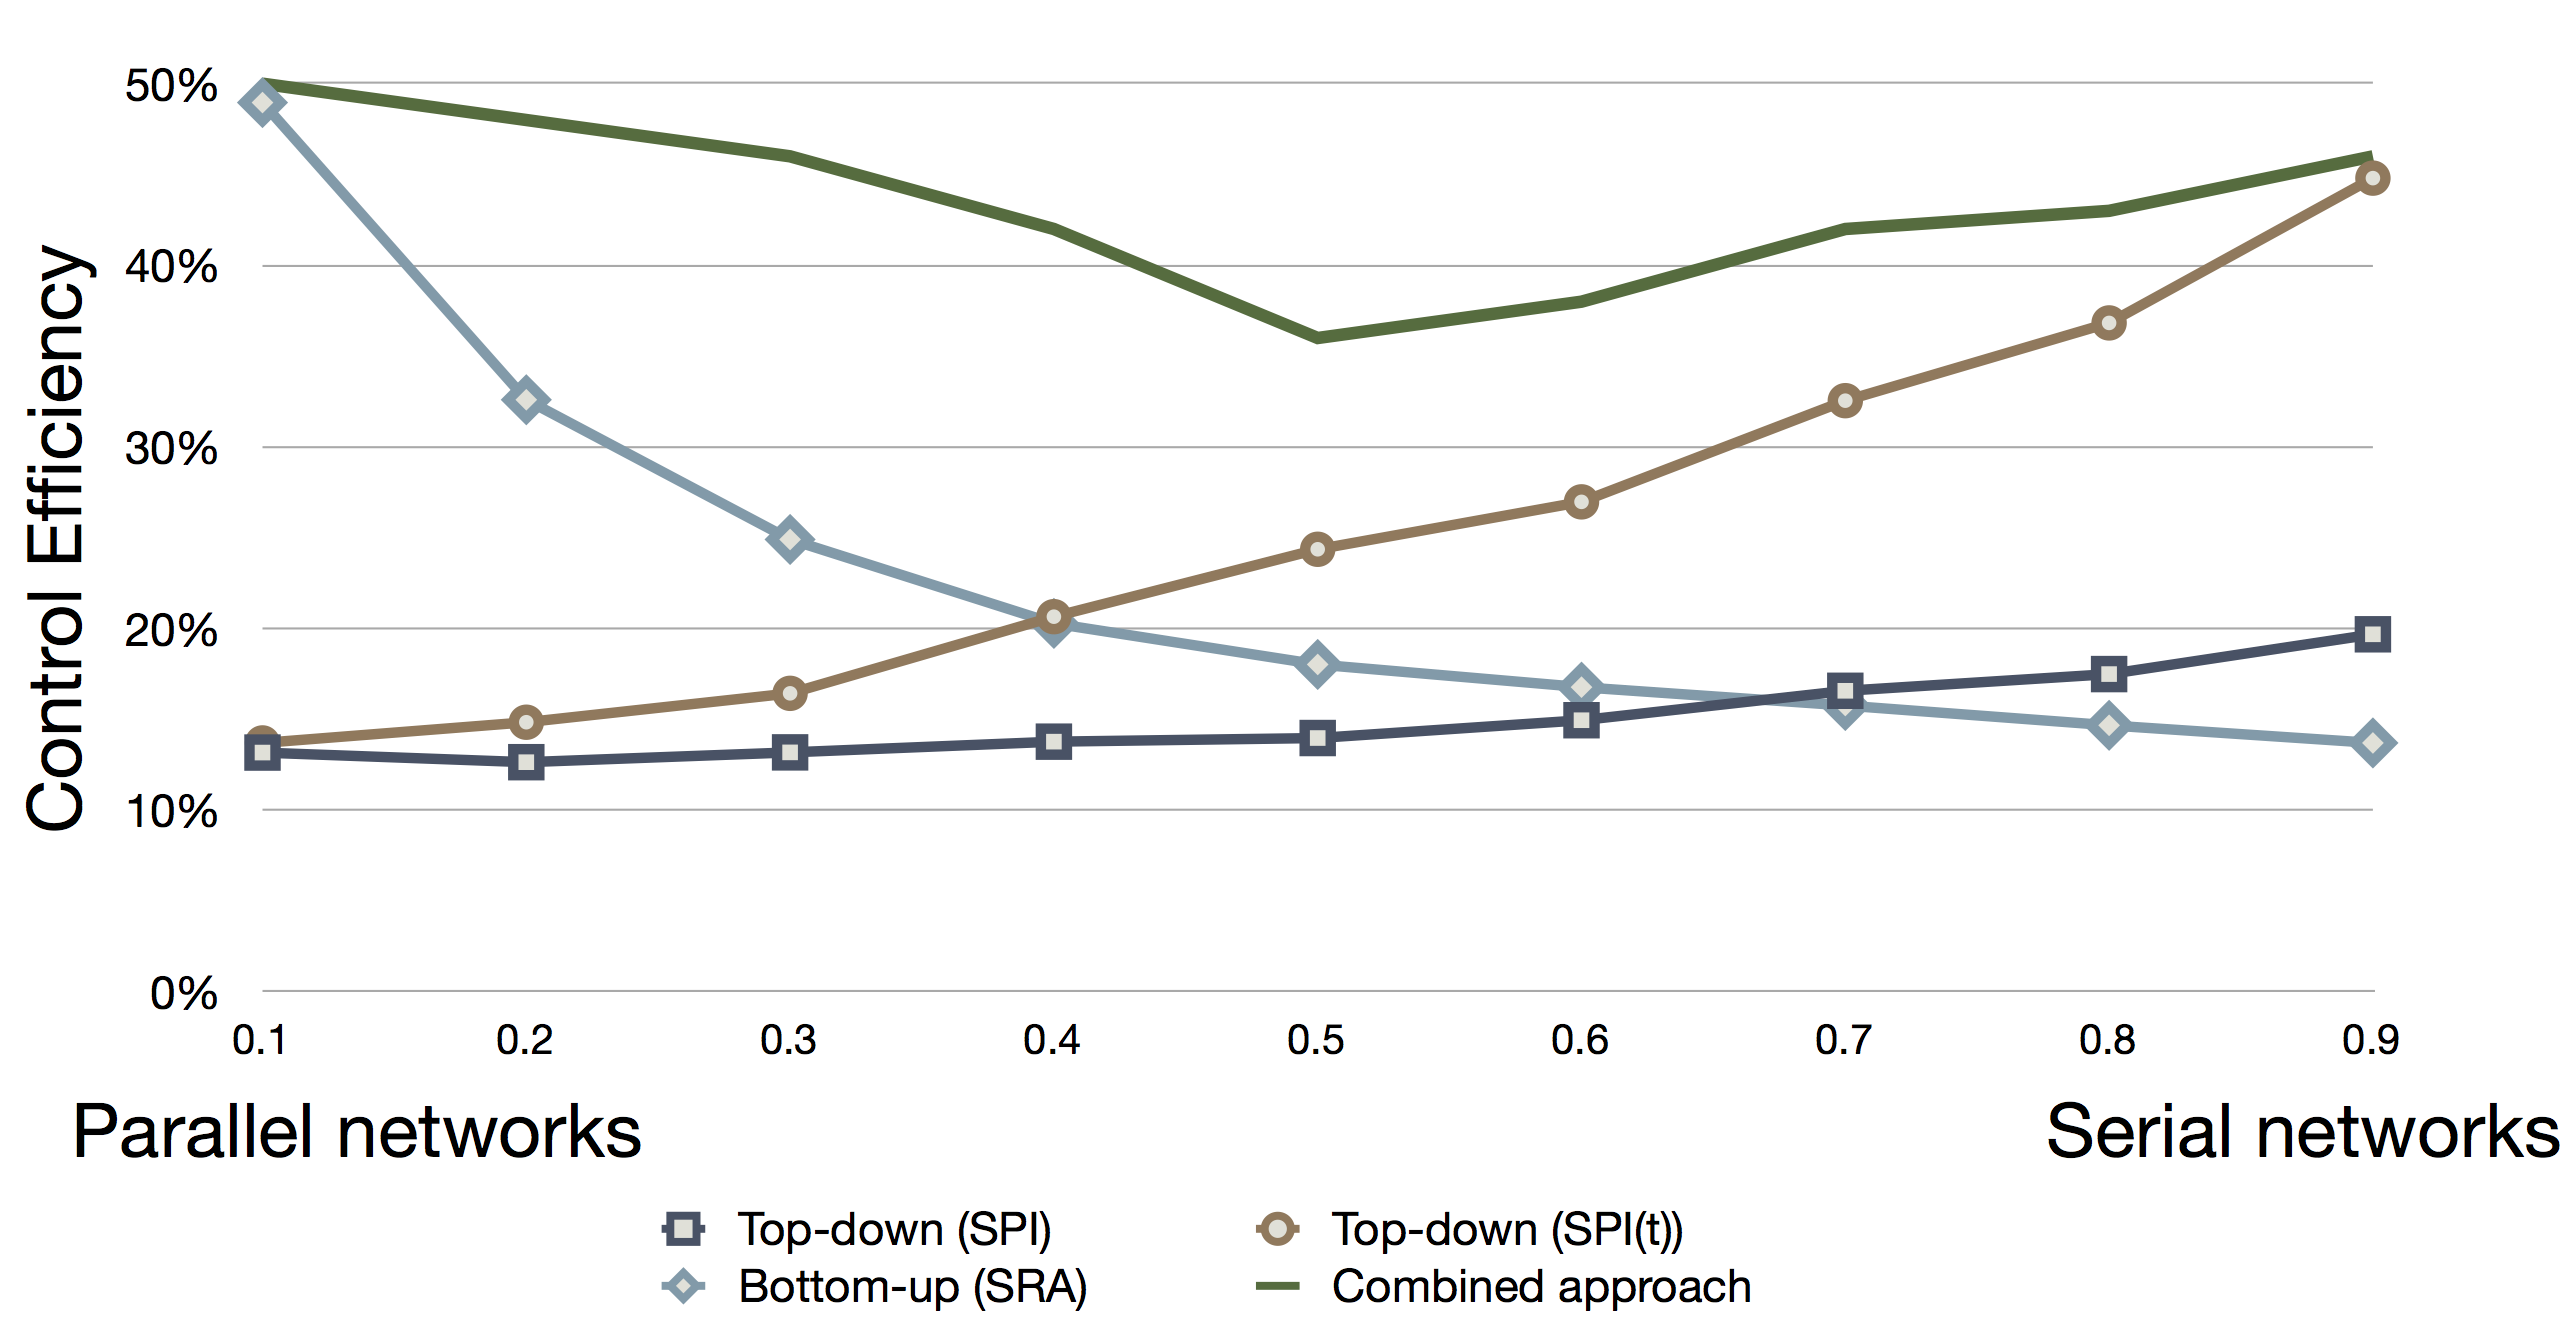
The efficiency of both control approaches is measured as a combination of these two factors. Figure 1 shows the control efficiency tested on a wide and diverse set of projects along the following dimensions.
- Project network structure (x-axis): More than 4,000 project networks have been used to test the control efficiency. These networks are fundamentally different from each other as measured by the topological structure. In figure 1, the projects range from projects with a lot of parallel activities to projects with a more serial structure.
- Control efficiency (y-axis): The efficiency of control is measured by a combination of the intensity of control and the impact of actions. A low level of control intensity and a high positive impact of the actions on the project objective result in a high control efficiency. Figure 1 compares the efficiency of two top-down control approaches, one bottom-up approach and one combined control approach.
?Figure 1: The control efficiency
The results of figure 1 can be summarized as follows:
- The top-down approach using the schedule performance index SPI shows a relatively low efficiency. This can be mainly contributed to the low reliability of the SPI at the final stages of the project (see “Earned Value Management: Reliable time performance measurement”).
- The top-down approach using the new schedule performance index SPI(t) is much more efficient, and this efficiency increases as the project becomes more and more serial.
- The bottom-up approach using schedule risk analysis (SRA) has a high efficiency when projects contain a lot of activities in parallel.
- The combined approach where both activity sensitivity information as well as project based performance indicators are used performs best and leads to a significant increase in the control efficiency.
© OR-AS. PM Knowledge Center is made by OR-AS bvba | Contact us at info@or-as.be | Visit us at www.or-as.be | Follow us at @ORASTalks
