
Schedule Risk Analysis: How to measure your baseline schedule’s sensitivity?
Schedule Risk Analysis (SRA) is a simple yet effective technique to connect the risk information of project activities to the baseline schedule, in order to provide sensitivity information of individual project activities to assess the potential impact of uncertainty on the final project duration and cost.
Since estimates about activity time and cost are predictions for the future and human beings often tend to be overly optimistic or, on the contrary, often add some reserve safety to protect themselves against unexpected events, knowledge about the potential impact of these estimation errors on the project objective is a key add-on to the construction of a project’s baseline schedule.
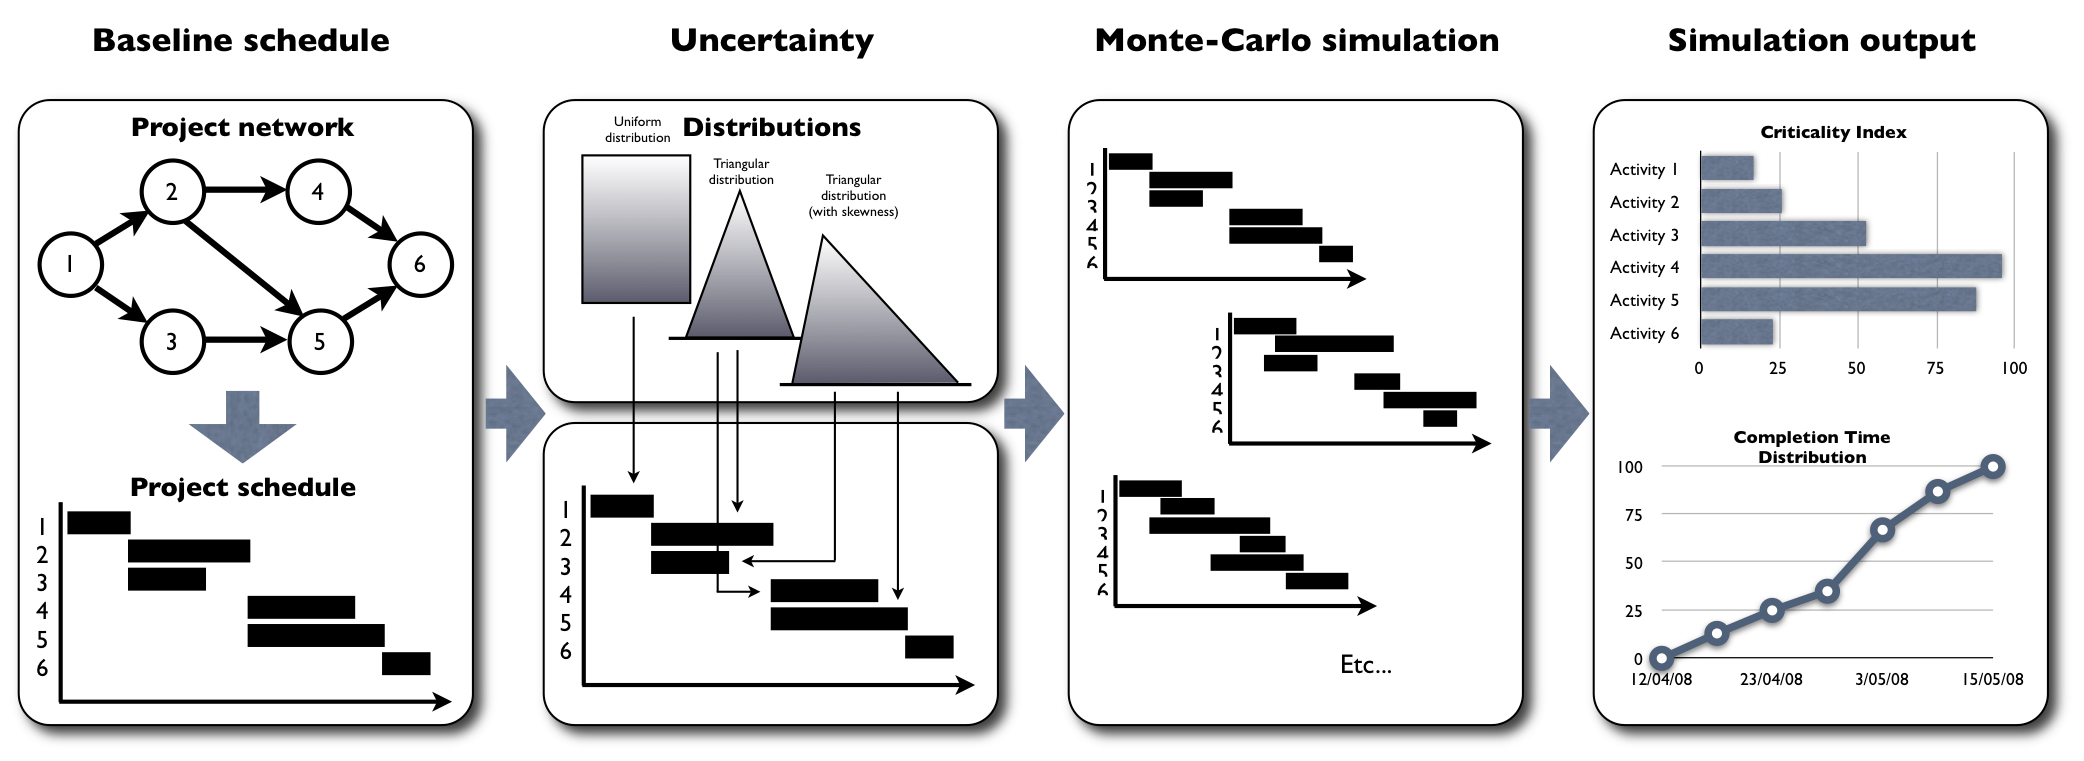
Figure 1. Four steps of schedule risk analysis
Figure 1 displays the four different steps of a schedule risk analysis.
Each step will be briefly explained along the following sections, and can be summarized as follows:
- Baseline schedule: Construct an activity timetable
- Define uncertainty: Define activity time and cost probability distributions
- Run Monte-Carlo simulations: Run multiple project progress simulations
- Interpret the simulation results: Interpret the sensitivity measures
Step 1. Baseline schedule
The construction of a project baseline schedule involves the definition of start and finish times for each project activity, using earliest and latest start calculations with or without the presence of limited resources. There is a wide range of techniques available (PERT, CPM, etc...) which will not be discussed in this article.
The project baseline schedule serves as a point of reference to which the simulated project progress of step 3 is compared to. Although it is generally accepted that it is very unlikely that everything will go according to plan, the baseline schedule plays a central role in schedule risk analysis and the lack of it would lead to incomparable data or even biased results.
Step 2. Define risk/uncertainty
Since time and cost estimates are often, if not always, subject to a margin or error, people feel more comfortable with a range of duration and cost estimates for project activities. Range estimates and risk assessment require analytical skills and basic knowledge of statistics which is often perceived as mathematically complex and sometimes theoretical and hence far from practice. However, a basic understanding of probability and distribution functions already allows the project manager to improve estimating the effects of unexpected events on the project outcome.
Step 3. Monte-Carlo simulations
Monte-Carlo simulation is a simple technique to quickly generate multiple runs simulating real project progress. Each simulation run generates a duration and cost for each project activity given its uncertainty profile defined in step 2. During each simulation run, the simulation engine records all project schedules and critical paths during progress in order to be able to measure the degree of activity sensitivity and the expected impact of activity variation on the project objective, as reported in step 4.
Step 4. Sensitivity results
The output of a schedule risk analysis is a set of measures that define the degree of activity criticality and sensitivity. These measures refine the black-and-white view of the critical path (which defines that an activity is either critical or not) to a degree of sensitivity, as follows:
- Criticality Index (CI): Measures the probability that an activity is on the critical path.
- Significance Index (SI): Measures the relative importance of an activity.
- Schedule Sensitivity Index (SSI): Measures the relative importance of an activity taking the CI into account.
- Cruciality Index (CRI): Measures the correlation between the activity duration/cost and the total project duration/cost.
Each measure gives the project manager an indication of how sensitive the activity is towards the final project duration or total cost (See ”Schedule Risk Analysis: Measuring the time sensitivity of an activity”). The values of the sensitivity measures are available upon completion of the simulation run and are used as triggers to focus on the risky activities which probably require higher attention in order to achieve successful project fulfillment (See ”Bottom-up project control: Setting action thresholds using schedule risk analysis”).
© OR-AS. PM Knowledge Center is made by OR-AS bvba | Contact us at info@or-as.be | Visit us at www.or-as.be | Follow us at @ORASTalks
