Schedule Risk Analysis (SRA) is a simple yet effective technique to connect the risk information of project activities to the baseline schedule, in order to provide sensitivity information of individual project activities to assess the potential impact of uncertainty on the final project duration. A traditional schedule risk analysis requires four steps, as described in “Schedule Risk Analysis: How to measure your baseline schedule’s sensitivity?”, to report activity sensitivity measures that evaluate each activity’s time estimate on a scale of risk. These sensitivity measures can be used by the project manager to distinguish between risky and non-risky activities in order to better focus on those activities that might have an impact on the overall project objective.
In this article, the Spearman’s rank correlation cruciality index (CRI(ρ) (rho)) calculations are illustrated on a fictitious example project network with 8 activities, as displayed in figure 1. The number above each node is the baseline duration estimate (in days).
?
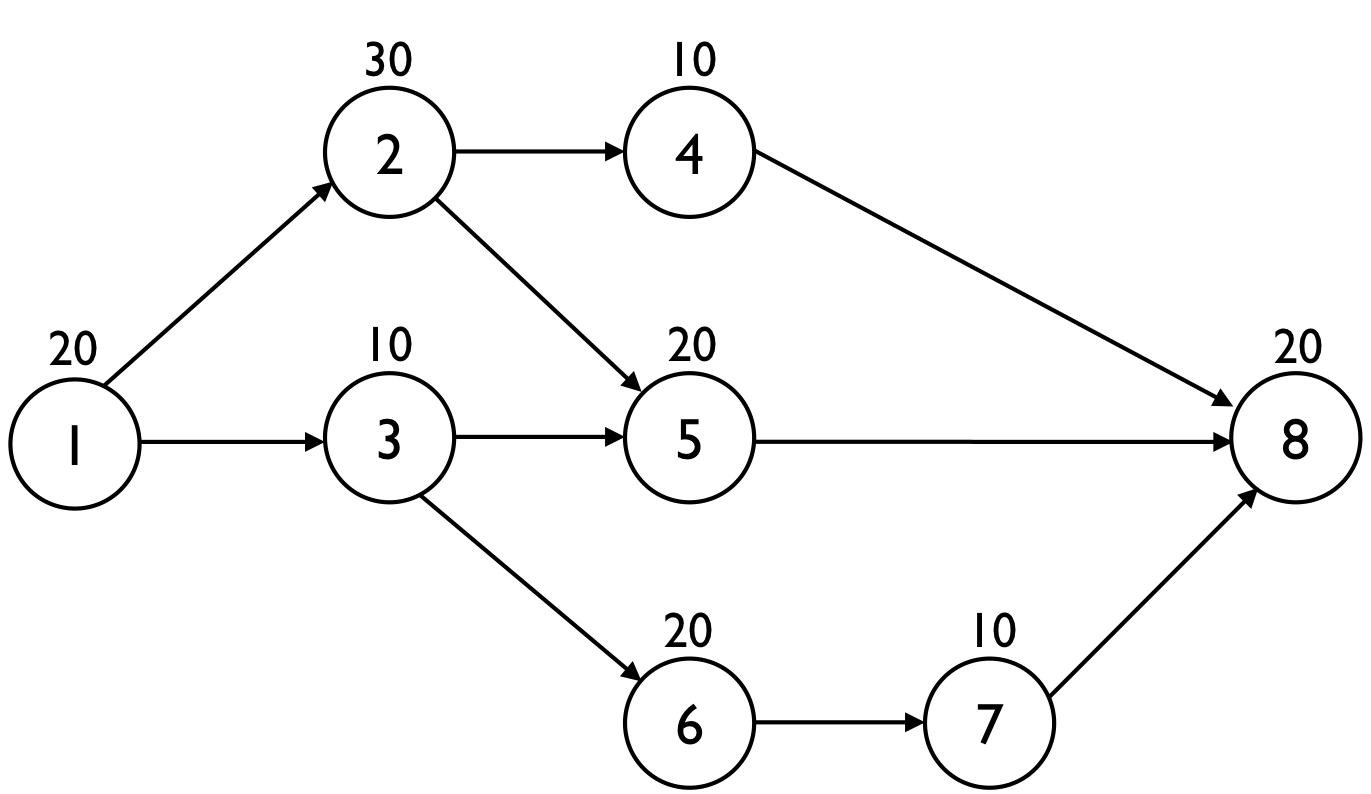
Figure 1: A fictitious example project network
The baseline schedule has a planned duration PD = 90 days and the critical path is equal to the activity sequence 1 - 2 - 5 - 8. However, the baseline schedule is only an estimate of the real project duration and hence, the real project duration and the critical path might differ from the baseline schedule estimates. Consequently, the critical path is a black-and-white view on the critical parts of a project, and should be refined to capture more detailed sensitivity information.
Cruciality index CRI(ρ)
The cruciality index (CRI) is such a measure that calculates the correlation between the activity duration and the total project duration, as follows:
CRI = |correlation(AvgAD, AvgSD)|
with
|x|: The absolute value of x
AvgAD: Average activity duration
AvgSD: Average simulated project duration
This measure reflects the relative importance of an activity and calculates the portion of total project duration uncertainty that can be explained by the uncertainty of an activity, and can be measured in different ways.
On way to measure the
CRI(r) is the Pearson's product-moment which is a traditional measure of the degree of linear relationship between two variables (see “Measuring time sensitivity in a project: the cruciality index (Pearson’s product-moment)”). However, when it is conjectured that the relation between the variables is non-linear, the Spearman's rank correlation CRI(ρ) might be a good alternative. The CRI(ρ) assumes that the values for the variables (i.e. activity durations and project durations) are converted to ranks, followed by the calculation of the difference between the ranks of each observation of the two variables. The measure is a so-called non-parametric measure to deal with situations where the strict statistical assumptions of the parametric CRI(r) measure are not met.
The Spearman’s rank correlation cruciality index CRI(ρ) can be calculated as follows:
CRI(ρ) = 1 - 6 * sum(DiffRank2) / {nrs* (nrs2 - 1)}
with
sum{x}: The sum of all x-values over all simulation runs
nrs: The number of simulation runs
DiffRank: The difference between the ranking values of AD and SD
Table 1 displays 10 simulation runs where each activity has a certain duration which might differ from the original baseline duration estimate given in figure 1. The simulated project duration (SD) for activities 1 to 8 per simulation run is also given. Each simulation run reflects a possible real project progress scenario where unexpected changes in the activity estimates might occur.
Table 1: 10 simulation runs with random activity durations
|
|
1 |
2 |
3 |
4 |
5 |
6 |
7 |
8 |
SD |
|
Run 1 |
4 |
12 |
1 |
4 |
5 |
4 |
7 |
8 |
29 |
|
Run 2 |
22 |
23 |
14 |
5 |
28 |
26 |
5 |
29 |
102 |
|
Run 3 |
25 |
38 |
12 |
15 |
24 |
20 |
13 |
22 |
109 |
|
Run 4 |
25 |
25 |
15 |
13 |
25 |
25 |
13 |
10 |
88 |
|
Run 5 |
21 |
42 |
12 |
7 |
30 |
21 |
14 |
23 |
116 |
|
Run 6 |
28 |
44 |
7 |
9 |
15 |
20 |
10 |
22 |
109 |
|
Run 7
|
19 |
21 |
14 |
13 |
23 |
24 |
14 |
28 |
99 |
|
Run 8 |
12 |
36 |
14 |
9 |
19 |
17 |
7 |
24 |
91 |
|
Run 9 |
28 |
35 |
7 |
12 |
28 |
27 |
13 |
28 |
119 |
|
Run 10 |
27 |
44 |
6 |
5 |
30 |
10 |
11 |
28 |
129 |
Based on the simulation runs, the cruciality index CRI(ρ) can be calculated with the intermediate calculations illustrated in table 2 for activity 2 of figure 1. In the example, the ranking values are given for AD and SD. Note that the average of the ranking values is calculated in case of tie breaks. As an example, activity 2 has two times a duration of 44 (simulation runs 6 and 10) and hence, the ranking value is equal to the average of 9 and 10 which is 9.5.
Based on the values in table 2, the CRI(ρ) can be easily calculated as follows:
CRI(ρ) = 1 - 6 * 46.5 / {10 * (102 - 1)} = 0.72
with sum(DiffRank2) = 46.5 equal to the sum of the last column of table 2.
Table 2: Intermediate calculations for the CRI(ρ) of activity 2
|
|
Ranking value activity 2
|
Ranking value SD
|
DiffRank2 |
|
Run 1 |
1 |
1 |
0 |
|
Run 2 |
3 |
5 |
4 |
|
Run 3 |
7 |
6.5 |
0.25 |
|
Run 4 |
4 |
2 |
4 |
|
Run 5 |
8 |
8 |
0 |
|
Run 6 |
9.5 |
6.5 |
9 |
|
Run 7 |
2 |
4 |
4 |
|
Run 8 |
6 |
3 |
9 |
|
Run 9 |
5 |
9 |
16 |
|
Run 10 |
9.5 |
10 |
0.25 |
Although activity 2 lies on the critical path of the baseline schedule, the cruciality index (based on Spearman’s rank correlation) is lower than 1. Figure 2 shows the CRI(ρ) values for all project activities, ranging between 0% and 72%. More precisely, the values are equal to 0.69, 0.72, 0.36, 0.00, 0.70, 0.16, 0.32 and 0.50 for activities 1 to 8. Obviously, a schedule risk analysis should be done with care for the following two reasons: (1) the input distributions of the activity duration should reflect reality, and (2) the number of simulation runs should exceed 10 to provide more reliable results.
?
Graph.png)
Figure 2: The cruciality index (Spearman’s rank correlation) values for the 8 activities after 10 simulation runs

