
Earned Value Management: Identifying the lack of schedule adherence
Submitted by Mario Vanhoucke on Mon, 12/12/2011 - 17:36
Controlling a project is key to the success or failure of the project. Earned Value Management (EVM) is a well-known technique to control the time and cost performance of a project and to predict the final project duration and cost. It is an easy tool to generate early warning signals to timely detect project problems or to exploit opportunities. An overview of the EVM metrics is given in “Earned Value Management: An overview” and the formulas are summarized in “Earned Value Management: The EVM formulary”.
EVM has been the topic of many extensions, among which the p-factor is a relatively recent one that is used to calculate the so-called schedule adherence of a project in progress. In this article, the following two topics will be discussed:
- Schedule adherence: Brief review of the concept measured by the p-factor and tool to calculate the effective earned value
- Project progress scenarios: Three example scenarios are given why the schedule adherence could be lower than 100% (perfect)
Schedule adherence
Measuring the adherence of a baseline schedule is presented in “Earned Value Management: Measuring schedule adherence” where the p-factor concept has been introduced as a tool to identify activity impediments or likely causes of rework. In “Earned Value Management: Schedule adherence and the effective earned value“, this p-factor is used to adapt the earned value by taking into account the work performed under risk. More precisely, it incorporates the possibility of rework and therefore calculates the effective earned value as the risk-free earned value and the remaining earned value portion performed under risk adapted with the probability for rework.
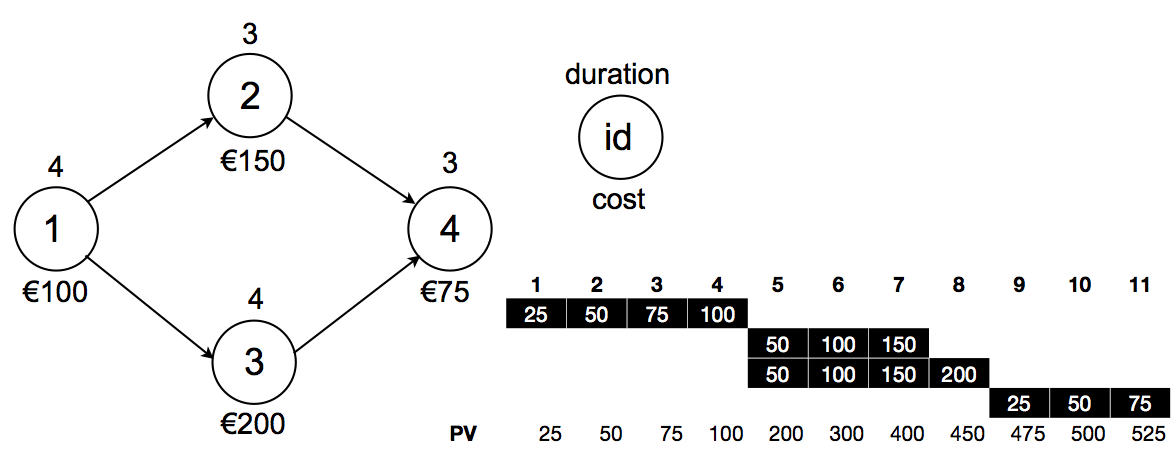
In this article, three possible scenarios will be discussed as illustrations of why the schedule adherence could deviate from the ideal situation (i.e. p-factor values less than 100%). To that purpose, the p-factor is calculated for a fictitious four-activity project network as displayed in figure 1, with the number above each node denoting the activity duration estimate and the number below the node indicating the associated cost. The figure also displays the baseline schedule with a total project duration PD = 11 weeks and a budget at completion BAC = € 525.
?Figure 1: A four-activity project network and its baseline schedule
Imperfect schedule adherence
The schedule adherence concept as measured by the p-factor is based on the earned schedule concept and compares the progress of the project measured by the accrue in earned value against the earned schedule at the current moment in time AT. P-factor values lower than 100% denote a lack of perfect schedule adherence and can be caused by various deviations from the original baseline schedule logic. In the remainder of this article, fictitious project progress is simulated using 3 scenarios to show possible reasons for a lack of perfect schedule adherence.
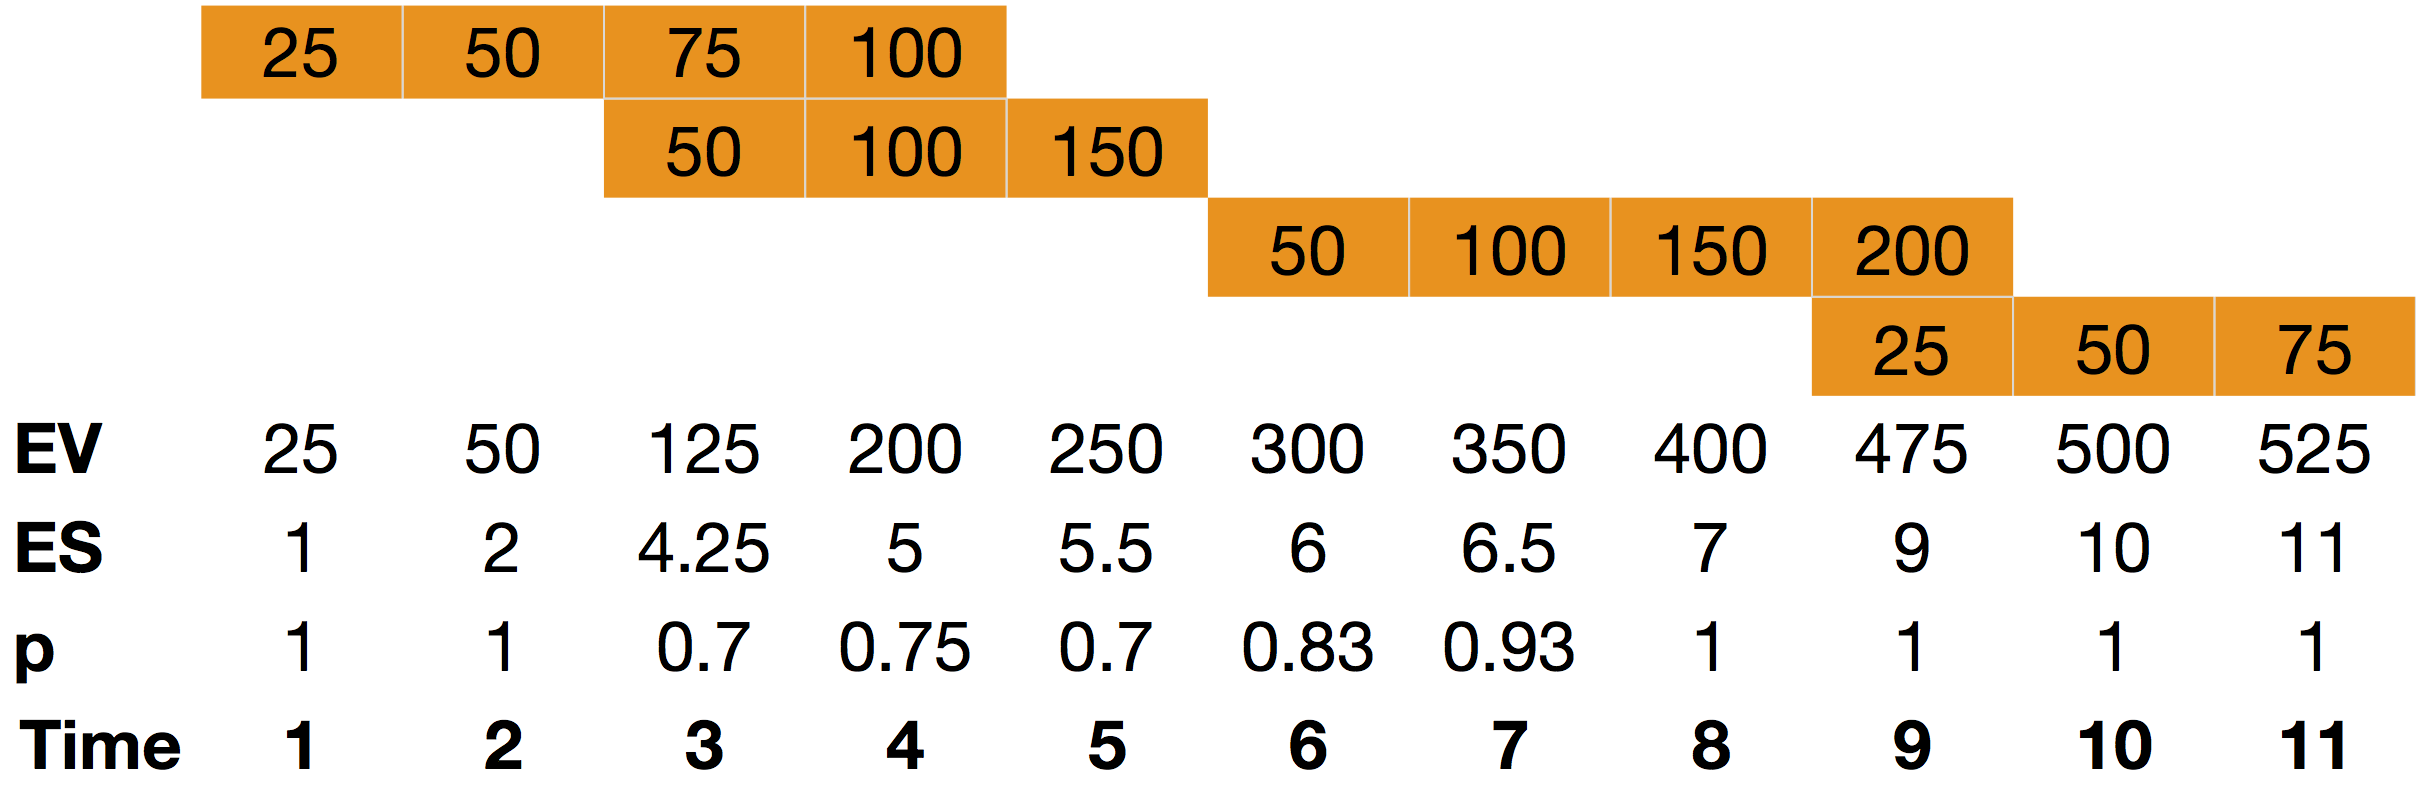
Activity Overlapping: The p-factor concept does not take the project network and its precedence relations into account, but instead takes a general project view on the schedule adherence based on earned value, planned value and earned schedule calculations. Nevertheless, the example in figure 2 shows that activity overlaps between activities 1 and 2 and between activities 3 and 4 lead to p-values lower than 100%. Activity overlaps give rise to activities that start earlier than allowed since their predecessor activity is not finished yet. This is probably the cause of a lack of information and an increased risk of rework. Figure 2 shows that the p-factor is able to detect this situation.
?Figure 2: Activity overlapping between activities 1 and 2 and 3 and 4
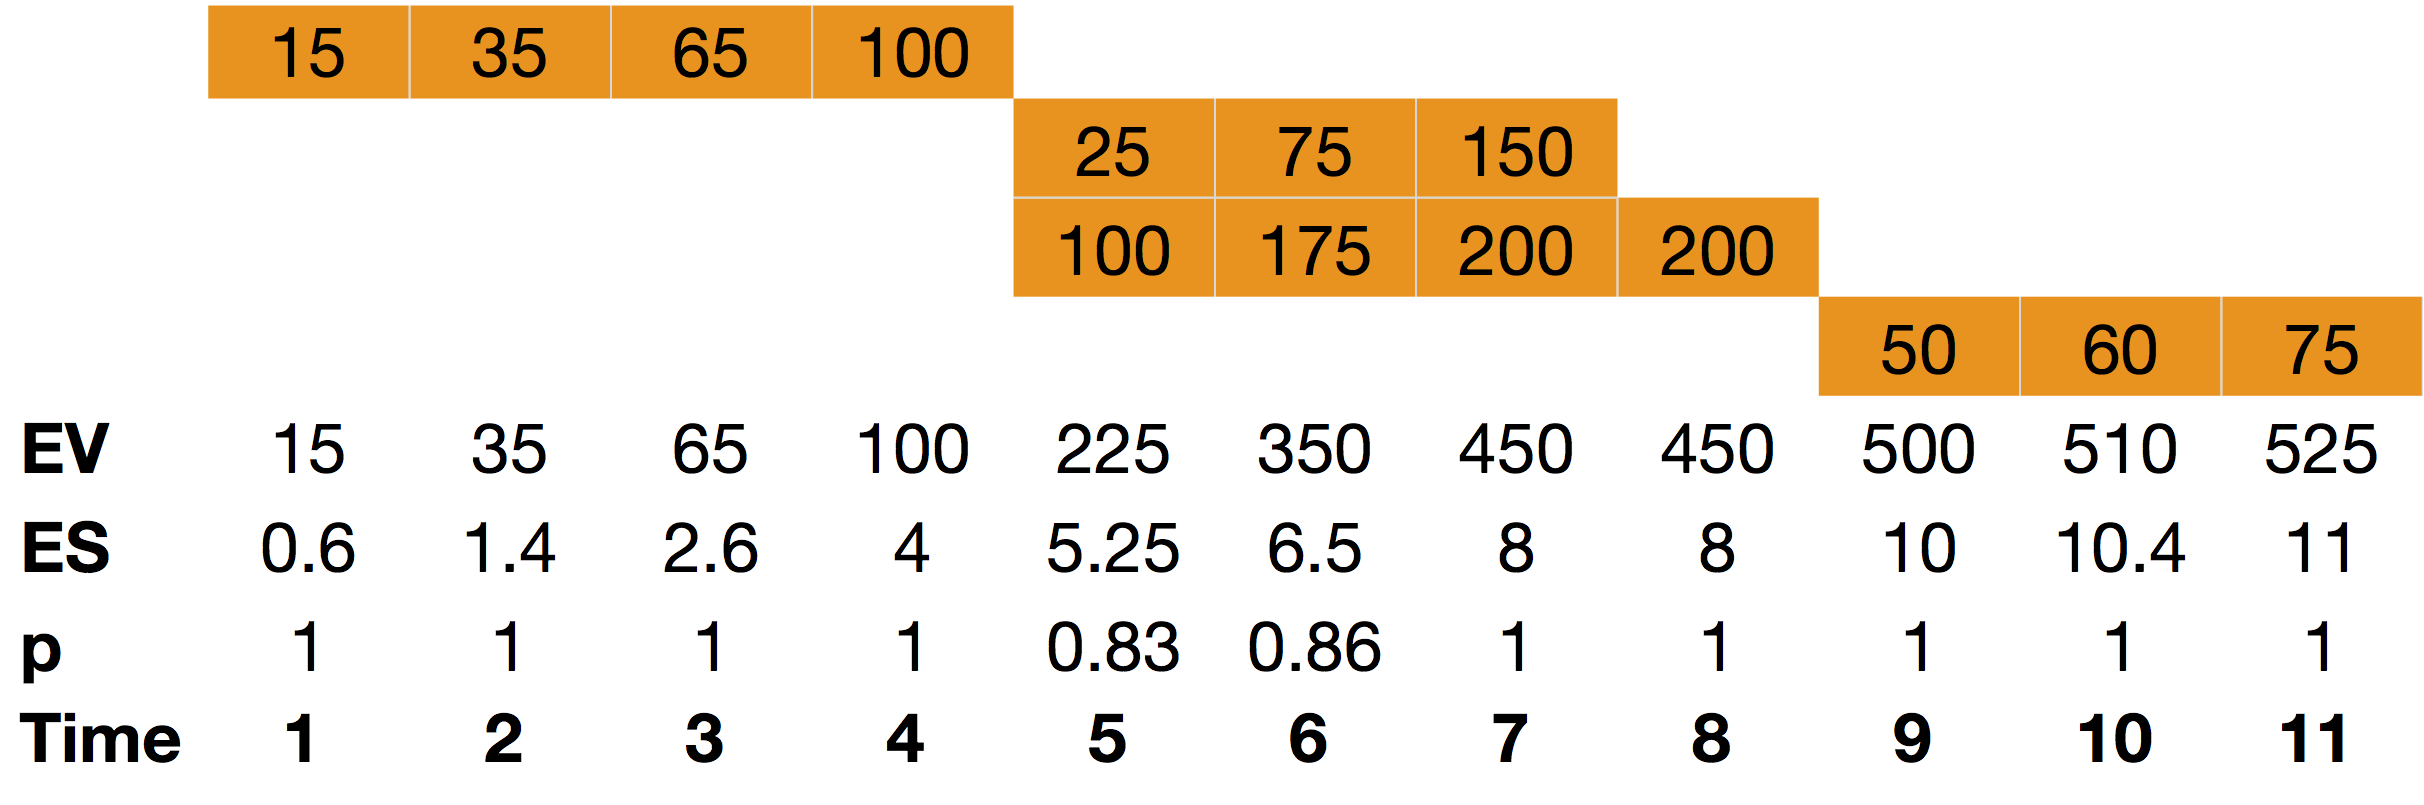
PV/EV Accrue Deviations: Activities that are completed within their estimated time and budget are not necessarily performed in congruence with their predefined planned value. Since the p-factor is a concept to measure the degree of adherence to the baseline schedule, expressed as a relation between the project progress (Earned Value) and the baseline schedule (Planned Value), it should be able to give an indication of the deviation between PV and EV. In figure 3, the EV accrued during the real life project progress is not in line with the PV curve of the baseline schedule, although the project finishes exactly on time. The PV is assumed to increase linearly along the activity duration (see figure 1), which is somewhat different for the activity progress in figure 3. The p-factor measures this lack of schedule adherence.
?Figure 3: Example where the accrue in PV and EV differs
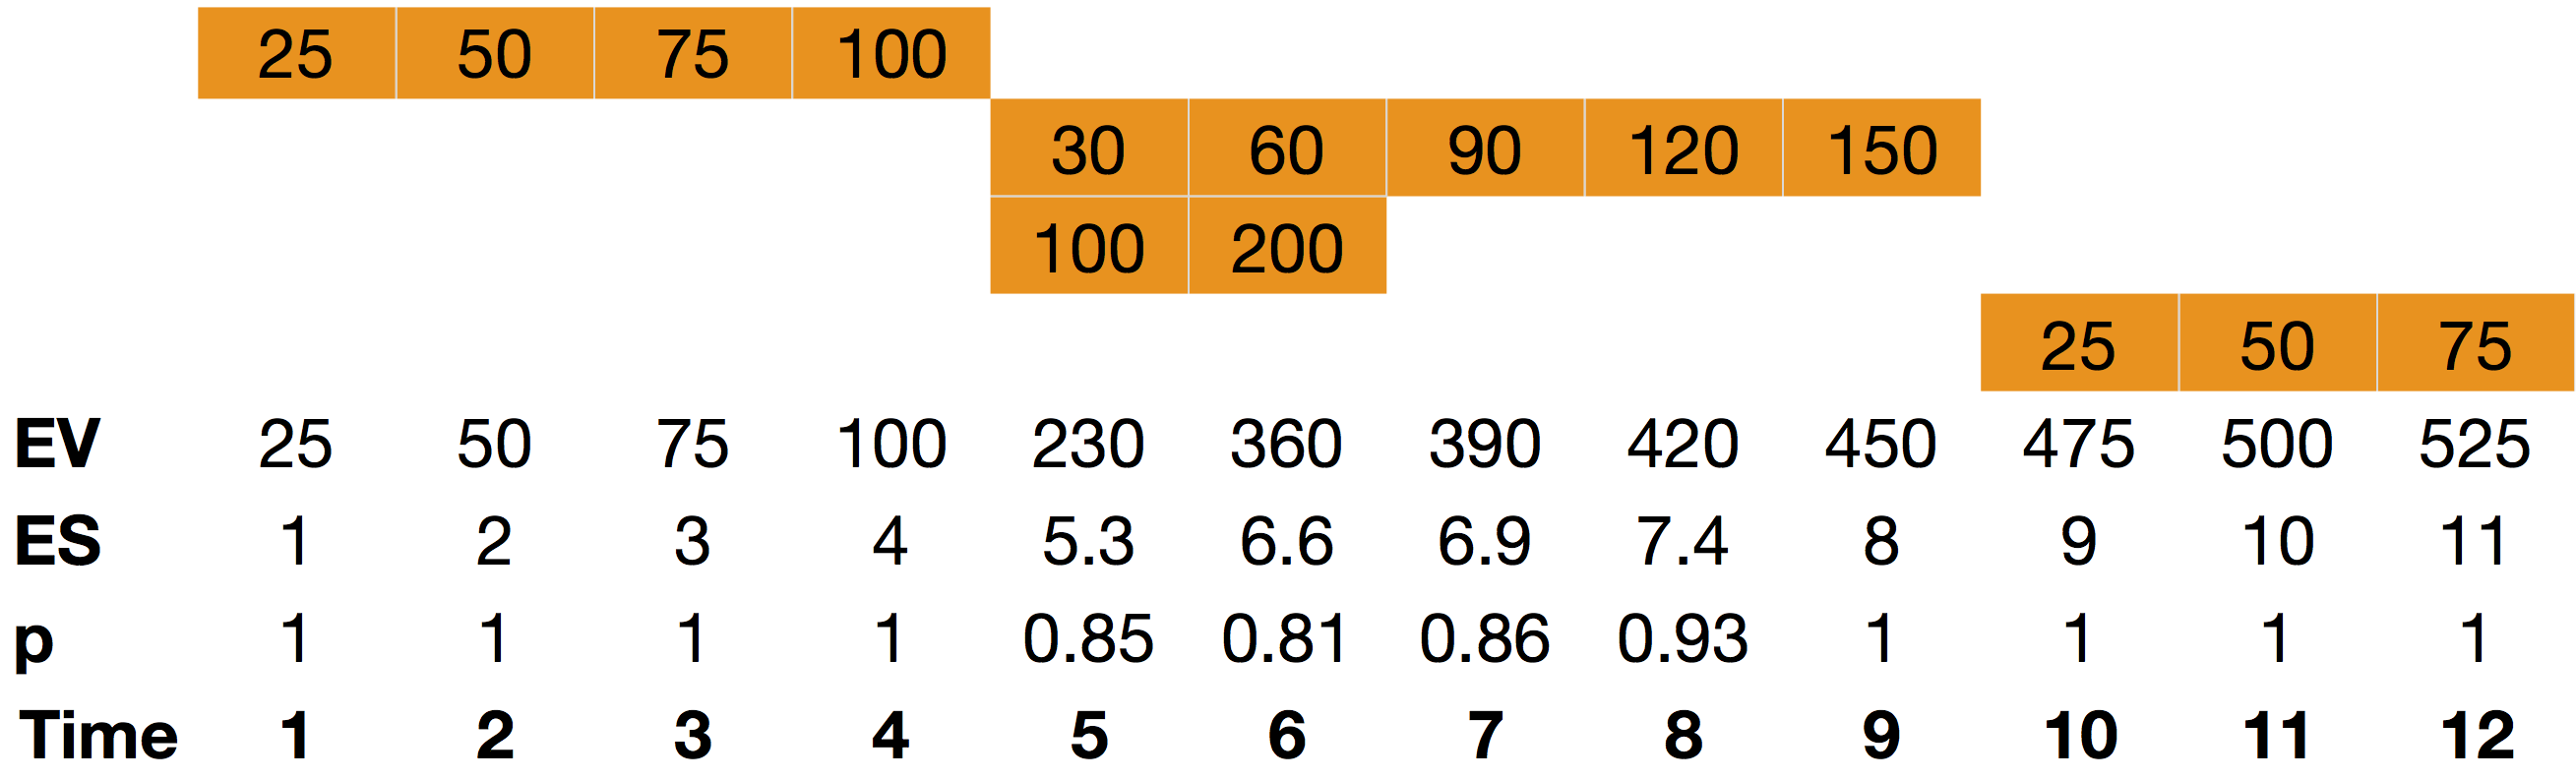
Ahead of Schedule and/or Delayed Project Execution: Obviously, deviations from the original baseline schedule during project progress lead to a project ending ahead or late. This lack of schedule adherence should be measured and reported by the p-factor concept in order to serve as a dynamic tool to forecast the final project status. Figure 4 shows a situation of a delayed project with activities finishing ahead of and behind schedule, resulting in p-factor values lower than 1.
?Figure 4: Project progress with a 1 week delay
© OR-AS. PM Knowledge Center is made by OR-AS bvba | Contact us at info@or-as.be | Visit us at www.or-as.be | Follow us at @ORASTalks
