Risk management requires analytical skills and basic knowledge of statistics, which is often perceived as mathematically complex and sometimes theoretical and far from practice. However, a basic understanding of probability and distribution functions allows the project manager to better estimate the effects of unexpected events on the project outcome. The use of single point estimates for the project data, such as activity durations and costs or the value of the time-lags between project activities (see “Activity links: How to add precedence relations between activities?”), often leads to unrealistic project estimates due to the inherent uncertainty that typifies these projects. Therefore, the use of statistical distributions is crucial for a thorough and realistic analysis of the project as a preparation of its future progress which will be characterized by changes compared to the original point estimates.
-
Single point estimates (= no risk): the activity entails no risk and the duration is a single point estimate (i.e. the estimate used in the baseline schedule)
-
Interval estimates (= risk): Using statistical distributions or making use of simple triangular distribution functions
In the next paragraphs, the use of interval estimates is discussed.
?Use statistics...
Defining uncertainty on project parameters using statistics requires a profound knowledge of the formulas and characteristics of statistical distribution functions. Once the parameters of these functions are known, one can easily transform any distribution function into a cumulative distribution function (CDF), which allows the generation of a random number from this function.
The use of cumulative distribution functions to generate numbers is described in “
Monte-Carlo simulations: How to imitate a project’s progress?”. Consider, as an example, the use of an exponential distribution. The cumulative distribution function of a random variable X that follows an exponential distribution can be given by
P(X ≤ x) = 1 − e−λx
with 1 / λ the mean of the exponential distribution.
When u is used as a parameter to denote the cumulative probability P(X ≤ x), which obviously lies between 0 and 1, one can have ?
u = 1 − e−λx → x = - 1 / λ * ln(1 - u) ?
Consequently, since u lies between 0 (inclusive) and 1 (exclusive), it can be replaced by a random number generated from the interval [0,1[. This can be obtained by a random number generator, e.g. the random wheel function RAND() that is available in Microsoft Excel. This leads to a randomly generated number x from an exponential distribution with an average equal to 1 / λ.
...or make it simple
The realism of using statistical distributions in practical settings is often questionable due to uniqueness of the project or lack of data about the specific probability distributions. However, the method can be used in research environments where the influence of various project parameters on the project outcome is measured under different scenarios by varying the parameters of well-known statistical probability distributions.
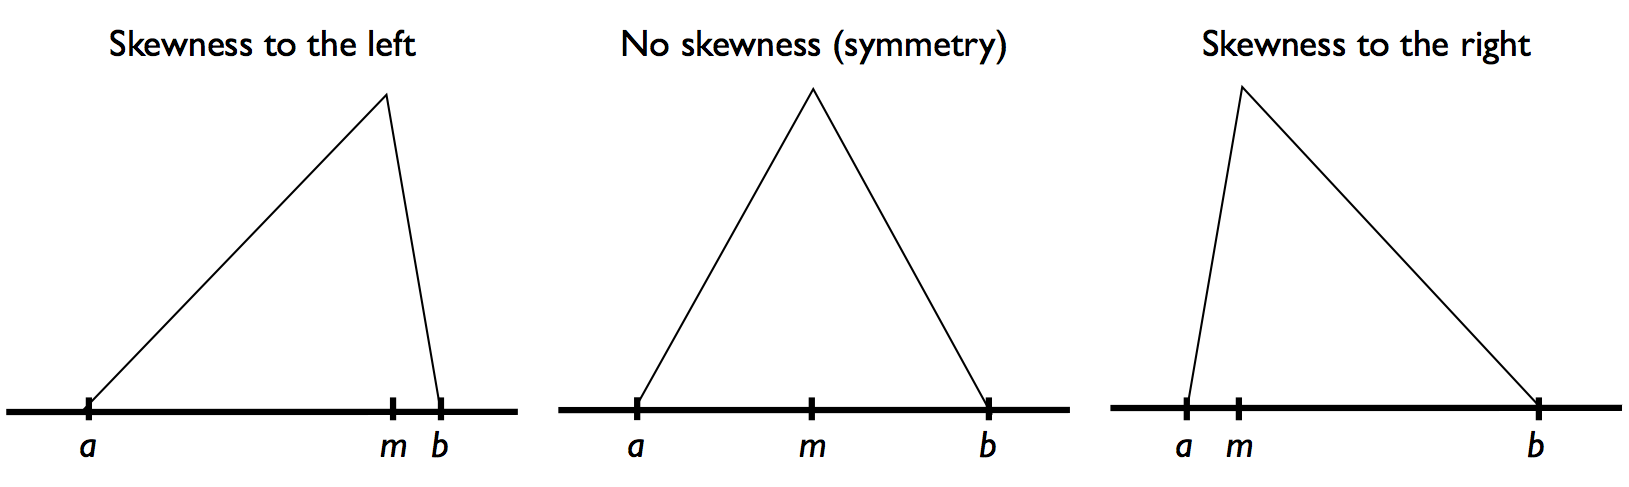
In practice, risk is often defined in a very subjective and vague way and can therefore be modeled through a degree of skewness as a measure of the asymmetry of the probability distribution of a real-valued random variable. The skewness approach can be easily used using simple three-point estimates (a,m,b) with a < m < b. Three-point estimates are widely used in project management for modeling the duration of project activities, as illustrated in “
The Program Evaluation and Review Technique (PERT): Incorporating activity time variability in a project schedule”. Three-point estimates can be used in the triangular distributions as shown in figure
1 to express risk as follows:
-
Skewed to the left: The activity is subject to risk within a certain range, where m - a > b - m.
-
Symmetric: The activity is subject to risk within a certain range, with worst case scenario a and best case scenario b symmetric above and below the value m, i.e. m - a = b - m.
-
Skewed to the right: The activity is subject to risk within a certain range, where m - a < b - m.
?
Figure 1. Illustration of triangular distributions with and without skewness
A basic knowledge about the statistical terminology and the willingness to rely on easy-to-use software tools like Microsoft Excel or graphical supported risk distribution tools allow the project manager to easily set up a schedule risk analysis. The use of basic three-point estimates for risk as an easy approximate alternative for the complex statistical distributions makes schedule risk analysis understandable to a broad audience. Obviously, more advanced distribution shapes are possible with more than three-point estimates as in the triangular distribution functions.
Relevance
Generally, the use of distributions instead of single point estimates in dynamic project scheduling replaces the deterministic nature of project parameters by interval estimates to have a more accurate and realistic estimate of the project outcome. As an example, the critical path method determines the longest path in a project network based on single point estimates for the activity durations (see “
Scheduling projects: How to determine the critical path using activity slack calculations?”) which results in a total project duration as a single value. When the activity duration estimates are replaced by interval estimates using probability distributions, the total project duration lies between two extreme values and consequently, the probability that the project will finish on or before a certain time from that interval can be calculated. This is illustrated in figure 2.
?Figure 2. A fixed and variable project duration as a result of single point or interval duration estimates


