
Updating the schedule: Setting actual and remaining cost values of activities in progress
Submitted by Mario Vanhoucke on Mon, 04/16/2012 - 16:00
One of the primary tasks during project control is periodically updating the baseline schedule to reflect the actual progress of the work done and to present a realistic forecast of the remaining work. Measuring the progress of a project can be done in various ways. The two most well-known and widely used techniques are:
- Earned Value Management (EVM): In this technique, the schedule predictions using the performance metrics available in EVM completely rely on estimates about the percentage completion of the activities and give a helicopter view on the performance of the project at the current status day. This technique is outside the scope of this article. Further references can be found in the “Earned Value Management: An overview” article.
- Critical Path Method (CPM): A more time-consuming and detailed alternative is to update the baseline Gantt chart at the activity level, which is often constructed using CPM techniques (or its extensions). In this so-called tracking Gantt chart, the schedule prediction is made by taking the actual and estimated remaining durations of each activity into account and by updating the Gantt chart. In doing so, the tracking Gantt chart gives a prediction of the future schedule based on the inputs of actual and remaining durations/costs of activities.
In this article, periodic updates of a project in progress using the tracking CPM Gantt chart are discussed. More precisely, the necessary inputs to periodically update the baseline schedule are described and illustrated by means of a simple two-activity project. In this article, the following three topics are discussed:
- Baseline schedule: Construct the baseline schedule to get the planned duration and budget at completion.
- Schedule update: Set the actual start, actual and remaining duration and actual and remaining cost values to update the schedule.
- Two remarks: Explain the difference between EVM and CPM schedule control and see whether the inclusion of resource costs will change the general approach discussed in this article.
Baseline schedule
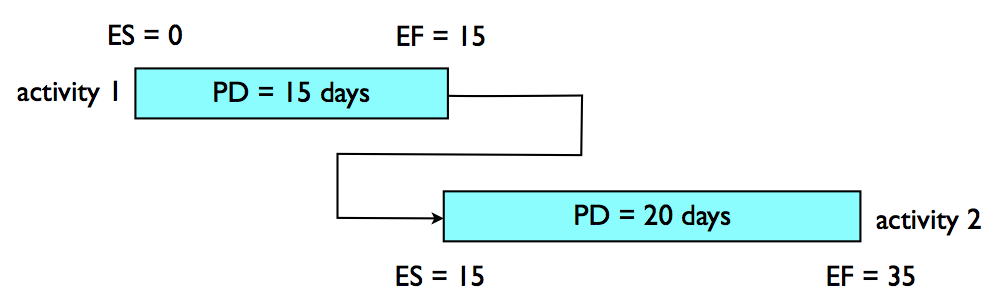
In figure 1, a two activity project baseline schedule is shown with a total duration of 35 days. The precedence relation between the two activities is assumed to be a finish-start relation with a minimal time-lag equal to zero. The earliest start (ES) and earliest finish (EF) times of each activity are indicated. The project example is borrowed from the “Schedule prediction: From a retained to an overridden logic” article. It is assumed that the activities do not need renewable or consumable resources and that the activity durations and costs are set to the following values:
-
Activity 1:
- Planned duration = 15 days
- Fixed cost = € 1,000
- Variable cost = € 50 per day
-
Activity 2:
- Planned duration = 20 days
- Fixed cost = € 2,000
- Variable cost = € 50 per day
?Figure 1: An example earliest start baseline schedule
Given the baseline information in figure 1, the total cost of the activities and the total project cost can be calculated following the guidelines in the “The cost of a project activity: Calculating the activity and/or resource costs” article, as follows:
- Activity 1: 1,000 + 15 * € 50 = € 1,750
- Activity 2: 2,000 + 20 * € 50 = € 3,000
and hence the total budget at completion (BAC) is equal to € 4,750.
Project in progress
A project in progress needs a periodic update of the baseline schedule to be able to see the impact of previous changes on the total expected project duration and cost. Therefore, progress input data must be given at regular times to update the portion of work already done and to predict the future changes and the impact on the total project duration and cost.
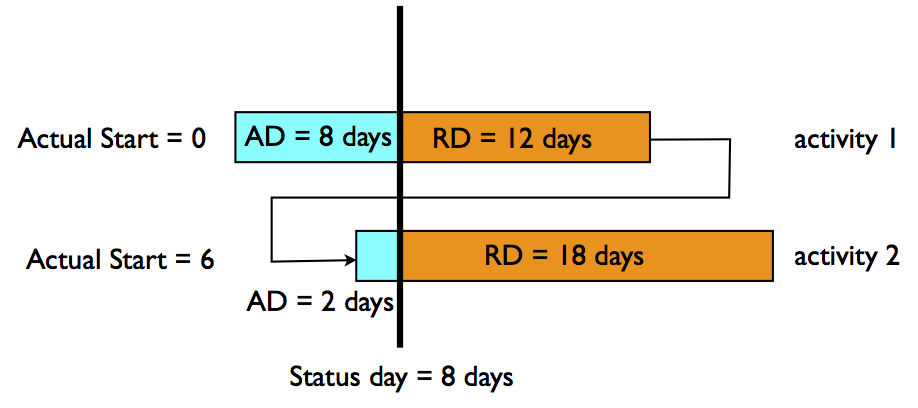
?Figure 2: Project in progress at status day = 8 (overridden logic)
Figure 2 displays the project tracking Gantt chart at status day 8. Even though activity 1 has not finished yet, activity 2 has already started despite the precedence relation between the two activities. This is known as an overridden schedule logic as explained in the “Schedule prediction: From a retained to an overridden logic” article.
Actual start
Updating the schedule during project progress results in activities that have already started (finished or in progress) and activities that still have to start. Therefore, a first crucial input metric to update the schedule is the actual start.
- Actual Start: Actual starting time of an activity on or before the status date which might differ from the original baseline start time.
The actual start times are set to 0 (activity 1, i.e. the project start) and day 6 for activity 2 to denote that both activities are in progress at day 8.
Actual and remaining duration
Activities in progress need an update about their actual and remaining durations which might differ from their baseline duration values. Therefore, two crucial input metrics need to be given to update the schedule, as follows:
- Actual Duration (AD): The time spent on an activity between its actual start time and the current status date. It represents the workload already spent on this activity until now (i.e. day 8).
- Remaining Duration (RD): A forecast of how many time units (hours, days, weeks, years) an activity will need from the status date forward to finish its remaining work.
Activity 1 has been in progress for 8 days (actual duration), and the project manager estimates that it will take another 12 days to finish this activity (remaining duration). Likewise, the actual duration for activity 2 is equal to 2 days while the remaining duration is estimated at 18 days.
Actual and remaining cost
Calculating the actual cost of the portion of work that is finished at the current time (day 8) and the remaining cost of the work that still has to be done is based on the estimates for the actual and remaining durations.
Estimating the actual cost of the portion of work finished for the activity can be done using the following three metrics:
- Actual Cost (AC): The actual cost for the work already done. Ideally, this actual cost should have a clear relation with the workload already done by the various resources assigned to this activity. It can be done based on time sheets for the various resources or based on knowledge about the actual spendings already made for the portion of work done for the activity. Since updating the resource time sheets to get the actual cost of an activity in progress can be a time-consuming task, a simple and effective alternative way to estimate the actual cost of an activity in progress can be done using the following formula:
Actual Cost
=
Planned Actual Cost + Planned Actual Cost Deviation
- Planned Actual Cost (PAC): The planned actual cost is calculated based on the baseline schedule information and is equal to the total planned activity cost given by the baseline schedule when the activity is in progress for AD time units. Consequently, the actual duration estimate to estimate the total workload spent on an activity in progress determines the planned actual cost for this activity. It is assumed that all costs are as planned and also the resources work as planned. For more information about calculating the total activity cost, see the “The cost of a project activity: Calculating the activity and/or resource costs” article.
- Planned Actual Cost Deviation (PACDev): Since uncertainty typifies projects or resources shift from time to time and work more or less efficient than originally planned, the actual cost of an activity in progress can differ from the planned actual cost. Consequently, the planned actual cost deviation is a way to express that difference, and hence, positive or negative values can be set to denote that the actual cost of an activity in progress is higher or lower than the planned actual cost. This PACDev replaces the various time sheets of resources.
In the example of figure 2, the planned actual cost is equal to € 1,000 + 8 * € 50 = € 1,400 for activity 1 and € 2,000 + 2 * € 50 = € 2,100 for activity 2. Consequently, the total actual cost of the portion of work done at day 8 is equal to € 3,500. In case the real actual cost is lower or higher than this estimated planned cost, the PACDev should be set to negative or positive cost values to update the actual cost.
Estimating the remaining cost of the remaining portion of work for the activity follows a similar approach, using the following three metrics:
- Remaining Cost (RC): A forecast of how many additional monetary resources (euro, dollars, ...) an activity requires to finish the portion of remaining work. Similar to the actual cost estimate, the remaining cost estimate can be determined in the following way:
Remaining Cost
=
Planned Remaining Cost + Planned Remaining Cost Deviation
- Planned Remaining Cost (PRC): The planned remaining cost is, similar to the planned actual cost, calculated automatically based on the remaining duration (RD) input.
- Planned Remaining Cost Deviation (PRCDev): In order to give a realistic estimate of the remaining cost, the planned remaining cost value can be modified using the optional planned remaining cost deviation field.
In the example of figure 2, the planned remaining cost is equal to 12 * 50 = € 600 for activity 1 and 18 * € 50 = € 900 for activity 2. Consequently, the total remaining cost of the remaining portion of work to be done from day 8 is equal to € 1,500. In case the remaining cost is expected to be lower or higher than this estimated planned cost, the PRCDev should be set to negative or positive cost values to update the remaining cost.
It should be noted that the total expected cost at completion is now equal to € 3,500 + € 1,500 = € 5,000 (when both PACDev and PRCDev are equal to zero), which exceeds the BAC of € 4,750 and therefore a cost overrun is expected.
Remarks
It should be noted that the EVM approach also has the objective of efficient project control, similar to the CPM schedule update method discussed in this article, but is however based on a Percentage Completed (PC) estimate.The PC estimate reflects the portion of the total workload that is estimated to be finished. The Earned Value metric EV is based on this estimate as EV = PC * BAC. Note that neither the actual/remaining duration nor the actual/remaining cost need to have a link with the PC estimate and will not be explicitly used for the calculation of the EV metric. More information can be found in the “Earned Value Management: The three key metrics” article.
It is also worth noting that in the example of figure 2, no costs for renewable and consumable resources have been taken into account. If resource costs would have been included, the schedule update principles would remain the same. The only difference would lie in the calculations of the PAC and PRC values, as discussed in the “The cost of a project activity: Calculating the activity and/or resource costs” article.
© OR-AS. PM Knowledge Center is made by OR-AS bvba | Contact us at info@or-as.be | Visit us at www.or-as.be | Follow us at @ORASTalks
