
Earned Value Management: The three key metrics
Submitted by Mario Vanhoucke on Mon, 12/12/2011 - 16:38
Controlling a project is key to the success or failure of the project. Earned Value Management (EVM) is a well-known technique to control the time and cost performance of a project and to predict the final project duration and cost. It is an easy tool to generate early warning signals to timely detect problems or to exploit project opportunities. An overview of the EVM metrics is given in “Earned Value Management: An overview” and the formulas are summarized in “Earned Value Management: The EVM formulary”.
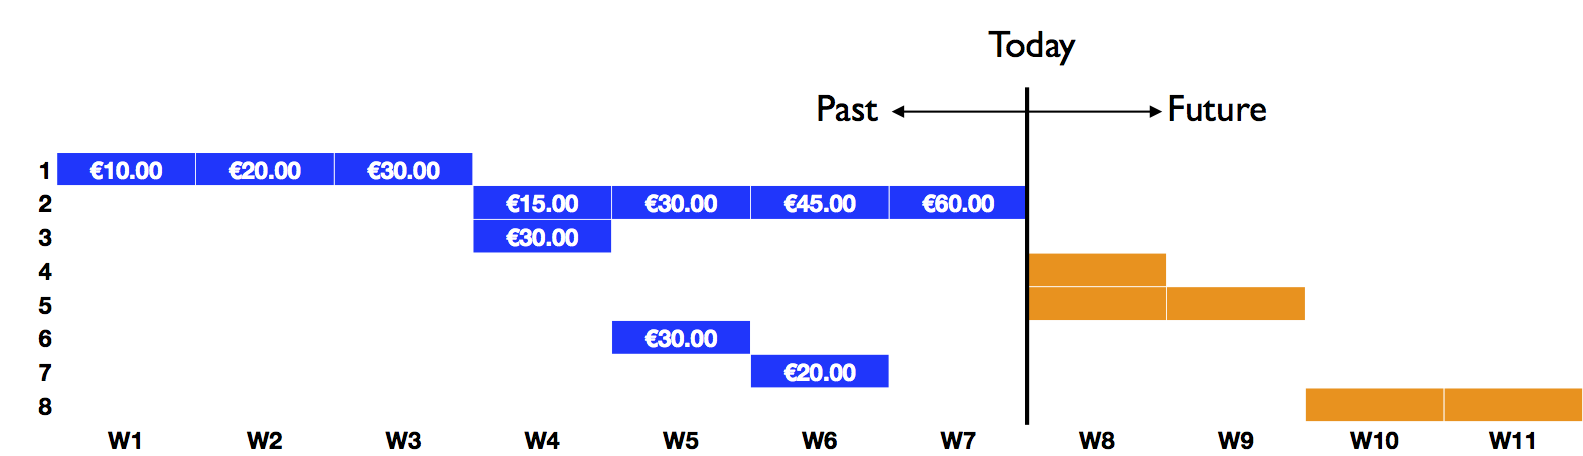
This article provides an overview of the way the earned value (EV) and actual costs (AC) are calculated and compared with the planned value (PV) in order to draw conclusions on the performance of a project in progress. All calculations are based on an example earliest start schedule Gantt chart of a fictitious project shown in figure 1.
?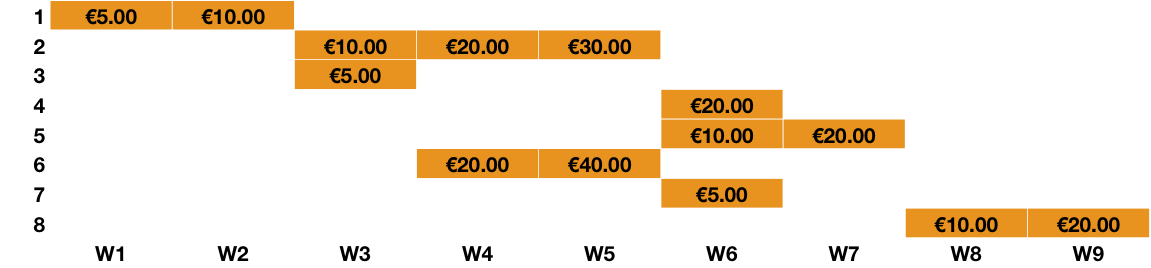
Figure 1: An example earliest start baseline schedule of a fictitious project
Baseline schedule
The Planned Value (PV) is a time-phased budget baseline as an immediate result of the baseline schedule, translated in monetary terms. Table 1 displays the cumulative planned value of a project with a planned duration PD = 9 weeks and a budget at completion BAC = € 150. The numbers are calculated in “Earned Value Management: The project baseline schedule’s planned value” and are displayed in table 1.
Table 1: Key metrics
| W1 | W2 | W3 | W4 | W5 | W6 | W7 | W8 | W9 | |
| PV | 5 | 10 | 25 | 55 | 85 | 120 | 130 | 140 | 150 |
| AC | 10 | 20 | 30 | 75 | 120 | 155 | 170 | ||
| EV | 3.33 | 6.67 | 10 | 22.5 | 70 | 82.5 | 90 |
Project progress
?
Figure 2 displays the real life progress of the project up to week 7, with activity delays in activities 1 and 2 and a faster execution for activity 6. The periodic cumulative actual cost is given in each bar of these activities which might differ from the planned costs as displayed in figure 1. Activities 4, 5 and 8 are ready to be started and are therefore displayed with their baseline duration. During the project progress, the actual cost and the percentage completed is measured in order to obtain periodic data as given in table 1.
Figure 2: Real life execution (project progress with cumulative actual cost values)
Based on the progress up to today, the two remaining key parameters can be calculated. The Actual Cost (AC) is equal to the cumulative actual cost spent at a given status date (i.e. week 7) as the sum of the actual spendings of all activities. The Earned Value (EV) represents the amount budgeted for performing the work that was accomplished by a given status date (week 7). It is measured as the percentage completed, which is often a subjective estimate made by the project manager, multiplied by the baseline schedule cost for each activity. Example calculations for weeks 6 and 7 are given along the following lines.
Example: week 6
- EV: 100% * € 10 + 75% * € 30 + 100% * € 5 + 100% * € 40 + 100% * € 5 = € 82.5
- AC: € 30 + € 45 + € 30 + € 30 + € 20 = € 155
Example: week 7
- EV: 100% * € 10 + 100% * € 30 + 100% * € 5 + 100% * € 40 + 100% * € 5 = € 90
- AC: € 30 + € 60 + € 30 + € 30 + € 20 = € 170
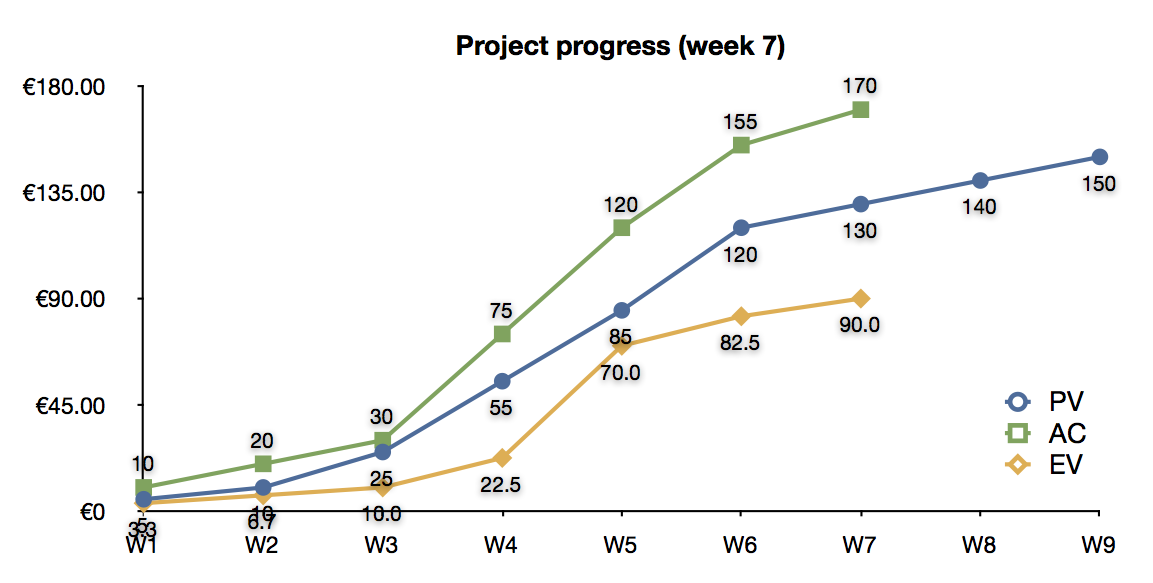
Figure 3 shows the S-curves for the three key parameters over time, up to week 7. Only the planned value is known from the project start until the end, as a result of the baseline schedule construction.
?Figure 3: The PV, EV and AC S-curves
The values for the three key parameters at week 7 can be interpreted as follows:
- The PV curve measures how much value should have been earned according to the baseline schedule at W7, and is equal to € 130.00.
- The EV curve measures how much value has been earned at the current time W7 given the work that has been done up to now, which is equal to € 90.00.
- The AC curve measures the actual cost incurred up to the current time W7 given the work that has been done and equals € 170.00.
Based on this information, the metrics can be used to measure the current and past performance of the project in progress. Since the baseline schedule (PV) stipulates that an additional € 40.00 should have been earned in week 7 compared to what was actually earned (EV), the project is clearly late. Since the value of the work done up to now (AC) exceeds the value that should have been earned with the current work done as stipulated in the baseline schedule (EV), the project is clearly over budget. These time and cost deviations (underruns and overruns) can be expressed by performance indicators, as discussed in “Earned Value Management: Measuring a project’s performance” and can be used to forecast the final project duration and total cost as explained in “Earned Value Management: Forecasting time” and “Earned Value Management: Forecasting cost”.
© OR-AS. PM Knowledge Center is made by OR-AS bvba | Contact us at info@or-as.be | Visit us at www.or-as.be | Follow us at @ORASTalks
