
Earned Value Management: Measuring schedule adherence
Submitted by Mario Vanhoucke on Mon, 12/12/2011 - 17:35
Controlling a project is key to the success or failure of the project. Earned Value Management (EVM) is a well-known technique to control the time and cost performance of a project and to predict the final project duration and cost. It is an easy tool to generate early warning signals to timely detect problems or to exploit project opportunities. An overview of the EVM metrics is given in “Earned Value Management: An overview” and the formulas are summarized in “Earned Value Management: The EVM formulary”.
In this article, a concept known as the p-factor will be discussed to measure the schedule adherence of a project in progress. The concept is based on the earned schedule metric as discussed in “Measuring Time: Earned value or earned schedule?”.
Schedule adherence
While the performance measures (SPI, SPI(t) and CPI) used in Earned Value Management compare the current project progress relative to the baseline schedule, the schedule adherence concept takes a different view on the current progress of the project. It does not evaluate the project performance against a static baseline schedule, but instead, relies on the dynamic earned schedule metric to measure the progress.
The rationale behind the schedule adherence concept lies in the observation that performing work not according to the baseline schedule often indicates activity impediments or is likely a cause of rework. Consequently, the basic idea is that whenever impediments occur (activities that are performed relatively less efficiently compared to the project progress), resources are shifted from these constrained activities to other activities where they could gain earned value. However, this results in a project execution which deviates from the original baseline schedule and might involve a certain degree of risk. Indeed, the latter activities are performed without the necessary inputs, and could result into a certain portion of rework. Based on these observations, the p-factor has been introduced by Lipke (2004) as a measure to provide the connection of project output to EVM. It measures the portion of earned value accrued in congruence with the baseline schedule, i.e. the tasks which ought to be either completed or in progress. A formal definition of the p-factor can be given as follows:
p-factor = sumi∈N min(PVi,ES, EVi,AT) / sumi∈N PVi,ES
with
N: The set of all activities of the project network
PVi,ES: The planned value of activity i at time ES
EVi,AT: The earned value of activity i at time AT
and
ES > AT (early), ES = AT (on time) or ES < AT (late).
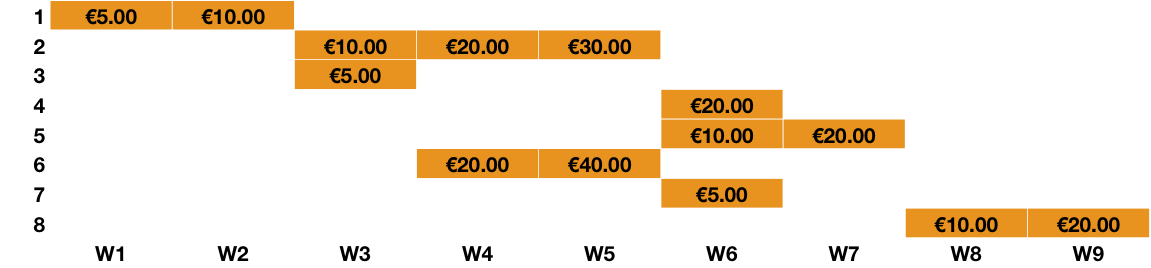
Figure 1 displays the cumulative planned values of the baseline schedule with a total planned duration PD = 9 weeks and a budget at completion BAC = € 150.00 (see “Earned Value Management: The project baseline schedule’s planned value“ for the calculations).
Figure 1: Baseline schedule (numbers are periodic planned values)
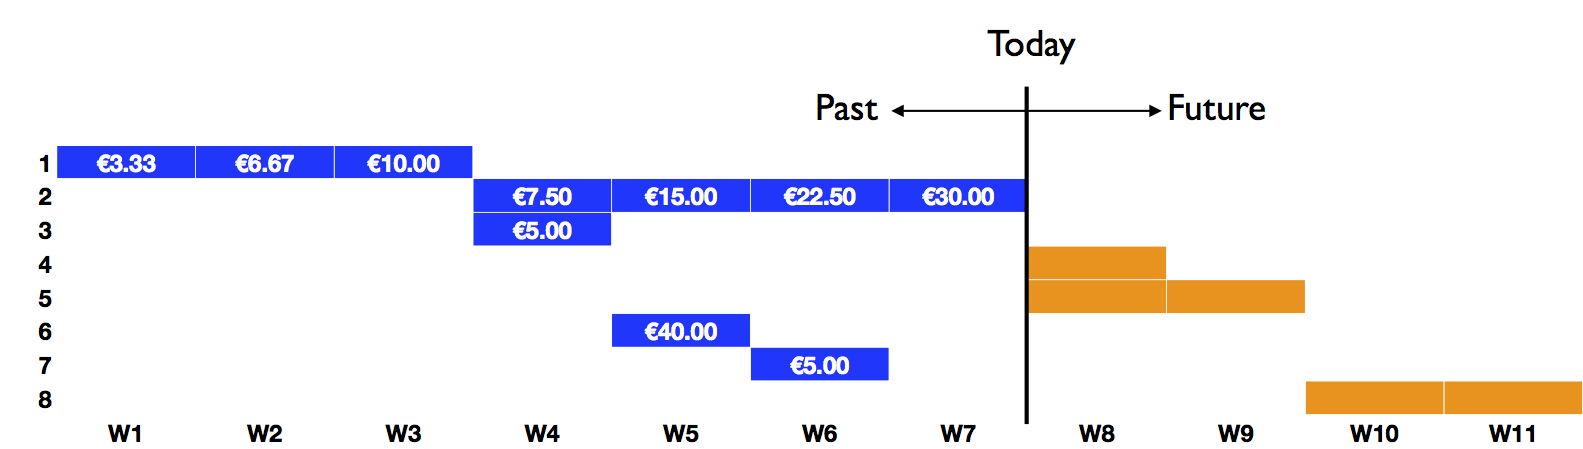
Figure 2 displays the project progress up to week 7 (i.e. actual time AT = week 7), with activity delays in activities 1 and 2 and a faster execution for activity 6. The periodic cumulative earned value is given in each bar of these activities. More detailed calculations can be found in “Earned Value Management: The three key metrics”.
?
Figure 2: Real project progress up to week 7 (numbers are periodic earned values)
In “Measuring Time: Earned value or earned schedule?”, it has been shown that the earned schedule metric can be easily calculated as ES = 5.14, which means that the project is clearly late.
Based on the data given in figure 1 (PV) and figure 2 (EV), the p-factor can be calculated at the actual time AT = week 7 as p-factor = {min(10,10) + min(30, 30) + min(5, 5) + min(0.14*20, 0) + min(0.14*10, 0) + min(40, 40) + min(0.14*5, 5) + min(0, 0)} / {10 + 30 + 5 + 0.14*20 + 0.14*10 + 40 + 0.14*5 + 0} = 85.7 / 89.9 = 0.95.
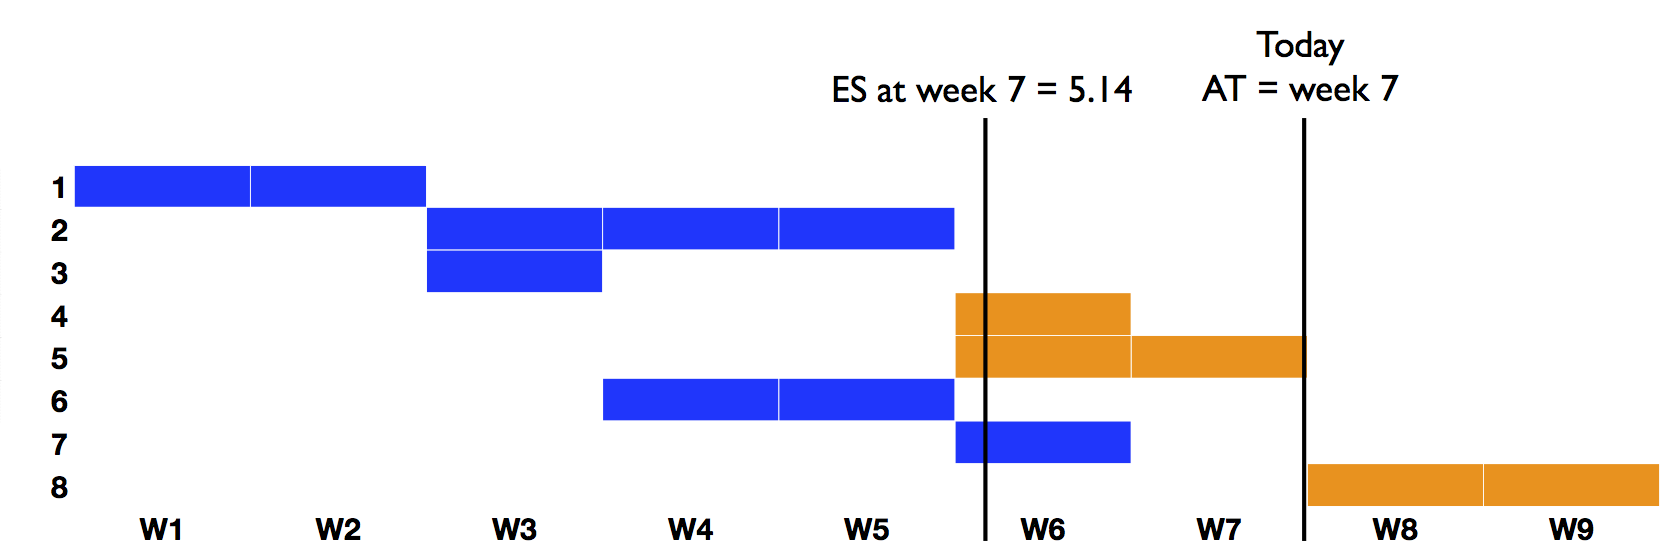
Figure 3 displays the baseline schedule with the activity progress in blue. The actual time AT = 7 while the ES = 5.14. Since the earned schedule ES expresses the time where the current amount of earned value should have been earned, activities 4 and 5 have made relatively little progress compared to the normal progress expressed by the ES metric while activity 7 has made more progress than originally captured in the baseline schedule at time 5.14. This is the reason why schedule adherence is only equal to 95% which is less than 100% (perfect schedule adherence).
?Figure 3: The schedule adherence concept shown on the baseline schedule
According to the schedule adherence concept, it is said that activities 4 and 5 show certain impediments while activity 7 has been performed under a certain degree of risk and might be the subject of rework. More information on the p-factor approach can be found in “Earned Value Management: Schedule adherence and the effective earned value” and “Earned Value Management: Identifying the lack of schedule adherence”.
© OR-AS. PM Knowledge Center is made by OR-AS bvba | Contact us at info@or-as.be | Visit us at www.or-as.be | Follow us at @ORASTalks
