
A critical note on PERT: A manual simulation study
PERT is a well-known and widely used project scheduling technique used to create an activity timetable taking variability activity durations into account. It relies on principles borrowed from statistics such as the central limit theorem and the normal distribution (see “The Program Evaluation and Review Technique (PERT): Incorporating activity time variability in a project schedule”).
However, PERT relies, like any other technique, on a number of underlying assumptions which needs to be put into the right perspective. The main PERT assumptions are given along the following lines:
- The activity durations are independent random variables
- The critical paths are independent (i.e. have no activities in common)
- The normal distribution can be applied (n is sufficiently large) thanks to the central limit theorem
Assumptions
Activity durations: The expected variance E(V) of a critical path is assumed to be equal to the sum of the variances of the critical activities, and hence, no covariances between activities are taken into account. Consequently, the activities are assumed to be independent.
Critical path: Independency of multiple critical paths is treated in PERT as follows: P(project duration ≤ project deadline T) = P(length critical path 1 ≤ project deadline T) * P(length critical path 2 ≤ project deadline T), with P(x) the probability of event x.
Normal distribution: The project duration is assumed to follow a normal distribution, independent of the distribution of the activity duration, as a result of the central limit theorem principles.
Validity?
In order to verify whether the underlying PERT assumptions are correct, a small manual simulation of a PERT project network will be described, as shown in figure 1. Each non-dummy activity can have 3 different durations, with an equal probability. Although PERT assumes a beta distribution with an upper limit (b), a lower limit (a) and a central mode (c), this simplification to three possible durations with an equal probability is made to enumerate all possible scenarios of the project of figure 1. This complete enumeration is given in table 1.
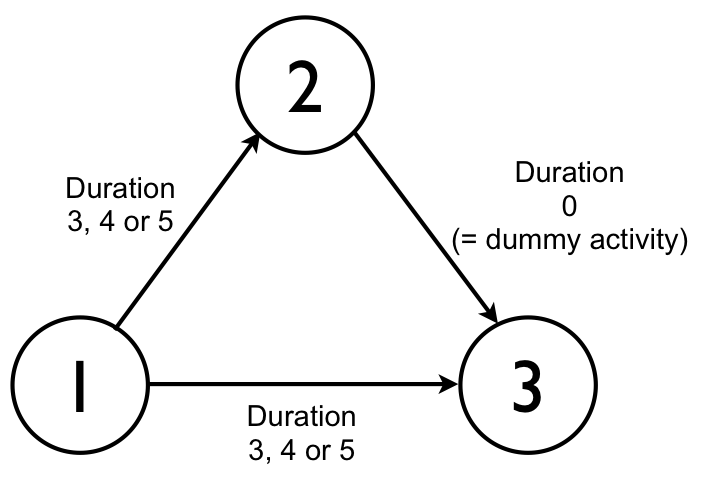
Figure 1: An activity-on-the-arc project network with 2 activities and 1 dummy activity
Following the principles of the PERT calculations, the expected length of the project is equal to the expected length of the critical path(s). Since each activity has an expected duration of 4 time units, the expected project duration is equal to 4 time units. Table 1, however, shows that the expected length is equal to 4.44 time units, which is more than the expected duration forecast by PERT.
Table 1: A complete enumeration of all possible activity durations
| Activity 1-2 | Activity 1-3 | Project duration |
| 3 | 3 | 3 |
| 3 | 4 | 4 |
| 3 | 5 | 5 |
| 4 | 3 | 4 |
| 4 | 4 | 4 |
| 4 | 5 | 5 |
| 5 | 3 | 5 |
| 5 | 4 | 5 |
| 5 | 5 | 5 |
| Average = 4.44 |
Therefore, it can be concluded that PERT throws an interesting light on project scheduling since it allows the incorporation of activity time variability in projects, but it not always able to predict the expected project duration for the following reasons:
- PERT fails to allow for time delays resulting from path interactions,
- Since numerous parallel paths may have the potential of becoming critical (because of randomness, some other paths, estimated as being noncritical, may in reality take longer to complete than the purported critical path), the expected project duration might be completely different.
© OR-AS. PM Knowledge Center is made by OR-AS bvba | Contact us at info@or-as.be | Visit us at www.or-as.be | Follow us at @ORASTalks
